
At times we see our tests fail or not show expected behavior. In such scenarios we need to identify the reasons for script failure or reason for unexpected behavior. This process is know as debugging. Debugging helps us to identify bugs in our application or correct our test case to show expected behavior.
Selenium IDE helps you debug your test cases. There are various option in Selenium IDE user interface through which you can debug your test case. Let us inspect them now.
We already inspected few elements on Selenium IDE user interface like "Play current test case", "Play entire test suite" and record button. Now let us look into other elements on its user interface.
- Pause/Resume -

Any point of time during the execution your test case, you can pause the execution by click on Pause/Resume button in Selenium IDE (refer snapshot)

This button comes handy when you want to check for an element on the webpage visually. At times we may want to confirm when you are not sure if the test case is behaving as expected, you may want to pause the execution, confirm the behavior and proceed further. Also note that this button is enabled only when a test case is being executed. Pause/Resume Icon changes to  after you pause the execution. Click on this button again to resume execution.
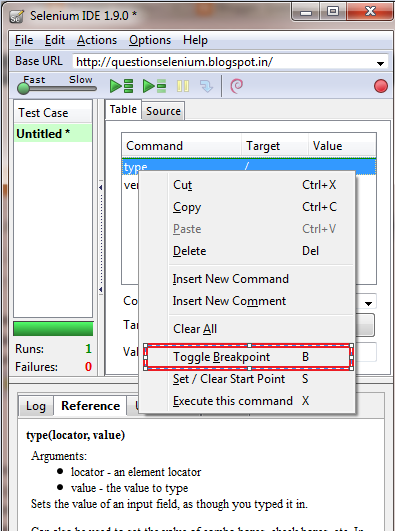
after you pause the execution. Click on this button again to resume execution. - BreakPoint - This is one of the important debugging tool. When you set a break point in your program, and click on Play test case, the execution of the test case will be paused at that break point automatically and will wait for user input(clicking on Pause/Resume button or Step Button) to resume the execution. To set a break point on any command, just right click on that command and from the drop down select "Toggle Break Point" . You can also remove the break point using the same option. (refer snapshot below)
- Step Button -

At times you want to execute test case's step by step i.e. command by command. In that case you can click on Play test case or Play test suite, pause the execution and use Step Button to execute your test case step by step. This is one important tool in debugging.
Note:
* you can also set the speed of execution to Fast or slow using bar on the Selenium IDE user interface.
* You can also run your recording/program/testcase step by step by double clicking on individual commands.
* you can also set the speed of execution to Fast or slow using
bar on the Selenium IDE user interface.* You can also run your recording/program/testcase step by step by double clicking on individual commands.


Thanks for your informative post on selenium automation testing tool. Your article helped me a lot in understanding the future of automation testing tool and its career prospects. Selenium Training | Best Selenium training institute in Chennai
ReplyDelete